AWS CloudWatch: Complete Monitoring and Alerting Guide
Learn how to monitor AWS infrastructure with CloudWatch metrics, logs, dashboards, alarms, CloudWatch Agent, Logs Insights, SNS notifications, and practical alerting strategies.
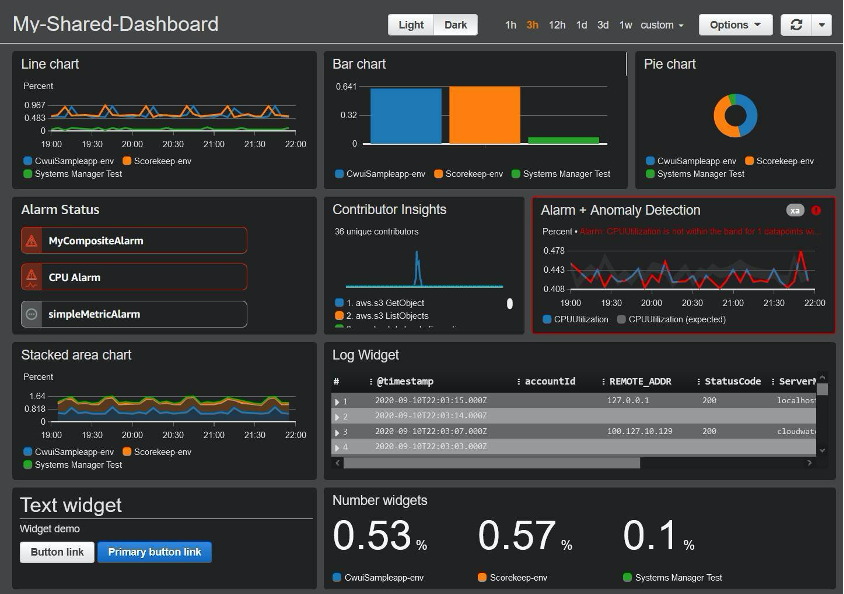
Monitoring is one of the most important parts of running reliable cloud infrastructure. Without monitoring, an application can fail, consume excessive resources, or experience performance problems without anyone noticing until users are affected.
Amazon CloudWatch provides monitoring and observability capabilities for AWS resources and applications. It can collect metrics and logs, visualize system behavior, create alarms, run automated actions and help engineers investigate incidents.
In this guide, we will build a practical understanding of CloudWatch and cover metrics, logs, dashboards, alarms, CloudWatch Agent, Logs Insights, notifications and alerting best practices.
What Is AWS CloudWatch?
Amazon CloudWatch is an AWS monitoring and observability service used to collect and analyze operational data from applications, AWS services and infrastructure.
A simple monitoring architecture looks like this:
AWS Resources
     |
     +---- EC2
     +---- RDS
     +---- Lambda
     +---- ALB
     +---- ECS
     |
     v
CloudWatch
     |
     +---- Metrics
     +---- Logs
     +---- Alarms
     +---- Dashboards
     +---- Logs Insights
     |
     v
Notifications / Automation
CloudWatch can therefore be used for both infrastructure monitoring and application troubleshooting.
CloudWatch Metrics vs Logs
One of the first concepts to understand is the difference between metrics and logs.
Metrics
Metrics are numerical measurements collected over time.
Examples include:
- EC2 CPU utilization
- Application Load Balancer request count
- RDS database connections
- Lambda invocation count
- Lambda error count
- Network traffic
Logs
Logs contain detailed event information generated by operating systems, applications and AWS services.
Metrics:
CPUUtilization = 87%

Logs:
2026-09-23 09:12:15 ERROR Database connection timeout
2026-09-23 09:12:17 ERROR Request failed
Metrics can tell you that something is wrong, while logs can often help explain why it is wrong.
1. Monitor EC2 CPU Utilization
EC2 instances publish several standard metrics to CloudWatch automatically.
One of the most commonly monitored metrics is CPU utilization.
CPUUtilization
      |
      v
CloudWatch Metric
      |
      v
CloudWatch Alarm
      |
      v
Notification
For example, you might create an alarm when CPU utilization remains above a defined threshold for several consecutive evaluation periods.
Avoid alerting on a single short CPU spike unless the workload specifically requires it. Short bursts can be normal.
2. Monitor Memory Usage on EC2
A common surprise for new AWS users is that memory utilization is not one of the standard EC2 metrics provided in the same way as CPU utilization.
If you need operating-system-level metrics such as memory utilization, disk usage or process information, install and configure the CloudWatch Agent.
EC2 Instance
     |
     v
CloudWatch Agent
     |
     +---- Memory
     +---- Disk
     +---- Processes
     +---- Custom Metrics
     |
     v
CloudWatch
3. Install the CloudWatch Agent
The CloudWatch Agent can collect additional system-level metrics and logs from EC2 instances and supported environments.
A typical workflow is:
- Install the CloudWatch Agent.
- Create or generate an agent configuration.
- Specify metrics and log files to collect.
- Grant the instance the required IAM permissions.
- Start the agent.
- Verify that metrics and logs are arriving in CloudWatch.
A configuration can collect information such as:
{
  "metrics": {
    "metrics_collected": {
      "mem": {
        "measurement": [
          "mem_used_percent"
        ]
      },
      "disk": {
        "measurement": [
          "used_percent"
        ]
      }
    }
  }
}
The exact configuration should be adapted to your operating system and monitoring requirements.
4. Monitor Disk Usage
Disk exhaustion can cause applications to fail even when CPU and memory look healthy.
For Linux servers, a useful local check is:
df -hIf the CloudWatch Agent is configured to publish filesystem metrics, create an alarm for important filesystems.
For example:
Disk Used
   |
   +---- 70%  Warning
   |
   +---- 85%  Alert
   |
   +---- 95%  Critical
The actual thresholds should be based on workload characteristics and how quickly administrators can respond.
5. Create a CloudWatch Alarm
A CloudWatch alarm watches a metric or expression and changes state when configured conditions are met.
A typical alarm contains:
- Metric
- Threshold
- Comparison operator
- Evaluation periods
- Period
- Alarm actions
Conceptually:
Metric
  |
  v
Is value above threshold?
  |
  +---- No ----> OK
  |
  +---- Yes
          |
          v
   Evaluation Period
          |
          v
        ALARM
          |
          v
   Notification / Action
6. Example: High CPU Alarm
Suppose an EC2 workload normally operates below 70% CPU but becomes unstable when CPU remains above 90%.
A possible alarm strategy could be:
Metric: CPUUtilization
Threshold: 90%
Evaluation: Multiple consecutive periods
Action: Notify operations team
Using multiple evaluation periods can reduce unnecessary alerts caused by short-lived spikes.
7. Send Alerts Through Amazon SNS
CloudWatch alarms can integrate with Amazon Simple Notification Service (SNS) for notifications.
CloudWatch Alarm
       |
       v
Amazon SNS
       |
       +---- Email
       +---- SMS
       +---- Application integration
       +---- Automation
A common production pattern is:
EC2 / RDS / ALB
       |
       v
CloudWatch Metric
       |
       v
CloudWatch Alarm
       |
       v
SNS Topic
       |
       v
Operations Team
8. Monitor Application Logs
Infrastructure metrics alone are not enough for application troubleshooting.
Application logs can contain:
- HTTP errors
- Database failures
- Authentication failures
- Application exceptions
- Timeouts
- External API failures
With the CloudWatch Agent, applications running on EC2 can send selected log files to CloudWatch Logs.
/var/log/application.log
          |
          v
CloudWatch Agent
          |
          v
CloudWatch Logs
          |
          v
Logs Insights
9. Understand Log Groups and Log Streams
CloudWatch Logs organizes log data into log groups and log streams.
A common structure might look like:
Log Group
|
+-- Instance-A Log Stream
|
+-- Instance-B Log Stream
|
+-- Instance-C Log Stream
Log groups can be used to organize logs by application, environment or service.
For example:
/production/web
/production/api
/staging/web
/staging/api
10. Search Logs Using CloudWatch Logs Insights
CloudWatch Logs Insights provides a query interface for analyzing log data.
A basic query can look like:
fields @timestamp, @message
| sort @timestamp desc
| limit 50
To search for errors:
fields @timestamp, @message
| filter @message like /ERROR/
| sort @timestamp desc
| limit 100
This can be useful during application incidents when you need to quickly identify recent errors.
11. Count Application Errors
You can also use Logs Insights to understand how frequently errors are occurring.
fields @timestamp, @message
| filter @message like /ERROR/
| stats count() as errorCount by bin(5m)
| sort @timestamp desc
This can help identify whether an application is experiencing a sudden increase in errors.
12. Build a CloudWatch Dashboard
Dashboards provide a centralized view of important metrics.
A production dashboard might contain:
+--------------------------------------+
| EC2 CPU       | Memory      | Disk   |
+--------------------------------------+
| ALB Requests  | 5xx Errors | Latency|
+--------------------------------------+
| RDS CPU       | Connections | Storage|
+--------------------------------------+
| Lambda Errors | Duration    | Invokes|
+--------------------------------------+
The goal is not to put every available metric on one dashboard. Focus on metrics that help answer operational questions quickly.
13. Monitor Application Load Balancers
Application Load Balancers expose several useful CloudWatch metrics.
Depending on your workload, monitor metrics related to:
- Request count
- Target response time
- HTTP 4xx responses
- HTTP 5xx responses
- Healthy targets
- Unhealthy targets
A sudden increase in 5xx responses can indicate application failures, target problems or infrastructure issues.
14. Monitor Amazon RDS
Database monitoring is critical because database performance problems can affect the entire application.
Useful RDS metrics can include:
- CPU utilization
- Database connections
- Free storage
- Read IOPS
- Write IOPS
- Read latency
- Write latency
Alarm thresholds should be based on the database workload rather than arbitrary values.
15. Monitor AWS Lambda
CloudWatch integrates closely with AWS Lambda.
Useful Lambda monitoring metrics include:
- Invocations
- Errors
- Duration
- Throttles
- Concurrent executions
A useful alarm strategy is to alert on sustained or significant error rates rather than every individual failed invocation.
16. Monitor HTTP 5xx Errors
HTTP 5xx errors often indicate server-side failures.
A useful architecture is:
Application
     |
     v
ALB
     |
     v
CloudWatch Metric
     |
     v
5xx Alarm
     |
     v
SNS
     |
     v
Operations Team
Combine infrastructure alerts with application logs so engineers can move from detection to root-cause investigation quickly.
17. Create Alerts That Engineers Can Actually Use
More alerts do not automatically mean better monitoring.
If engineers receive hundreds of notifications every day, important alerts can be ignored.
Good alerts should be:
- Actionable.
- Relevant.
- Specific.
- Based on meaningful thresholds.
- Connected to a documented response.
For example, instead of creating an alert for every temporary CPU spike, alert when CPU remains high long enough to indicate a likely operational problem.
18. Warning vs Critical Alerts
Different severity levels can make alert handling easier.
Metric
  |
  +---- Warning ----> Monitor / Investigate
  |
  +---- Critical ---> Immediate Response
For example:
- Warning: elevated resource usage.
- Critical: sustained resource exhaustion or service failure.
The exact thresholds should be based on the application and operational requirements.
19. Monitor the Four Golden Signals
A useful framework for application monitoring is to track four broad signals:
- Latency — How long requests take.
- Traffic — How much demand the system is receiving.
- Errors — How many requests are failing.
- Saturation — How close the system is to its capacity limits.
These signals can provide a more useful picture of application health than monitoring CPU utilization alone.
20. Monitor From the User's Perspective
Infrastructure can appear healthy while users are still experiencing problems.
For example:
EC2 CPU       = Normal
Memory        = Normal
Disk          = Normal

But...

Application Response Time = High
HTTP 5xx                  = Increasing
User Experience           = Poor
This is why application-level metrics and synthetic monitoring can be valuable in addition to infrastructure metrics.
CloudWatch Alarm Troubleshooting
If an alarm is not behaving as expected, check the following.
Metric Is Missing
Verify that the resource is publishing the metric and that you selected the correct namespace, metric name and dimensions.
Alarm Remains in INSUFFICIENT_DATA
This can occur when the alarm does not have enough metric data to evaluate its condition or when metric publishing has stopped.
Alarm Fires Too Often
Review the threshold, evaluation periods and period length. Short-lived spikes may require a different evaluation strategy.
No Notification Is Received
Verify the alarm action and SNS configuration. If email subscriptions are used, confirm that the subscription has been confirmed.
CloudWatch Monitoring Architecture
                     AWS Environment
                           |
       +-------------------+-------------------+
       |                   |                   |
      EC2                 RDS                ALB
       |                   |                   |
       +-------------------+-------------------+
                           |
                           v
                      CloudWatch
                           |
        +------------------+------------------+
        |                  |                  |
      Metrics             Logs            Events
        |                  |                  |
        v                  v                  v
     Alarms          Logs Insights       Automation
        |
        v
       SNS
        |
        v
 Operations / On-Call
Useful CloudWatch CLI Commands
AWS CLI can be useful for inspecting metrics, alarms and log groups.
# List CloudWatch alarms
aws cloudwatch describe-alarms

# List metric alarms
aws cloudwatch describe-alarms \
  --state-value ALARM

# List log groups
aws logs describe-log-groups

# List log streams
aws logs describe-log-streams \
  --log-group-name /production/application

# Get metric statistics
aws cloudwatch get-metric-statistics \
  --namespace AWS/EC2 \
  --metric-name CPUUtilization \
  --dimensions Name=InstanceId,Value=i-xxxxxxxxxxxxxxxxx \
  --statistics Average \
  --period 300 \
  --start-time 2026-09-23T00:00:00Z \
  --end-time 2026-09-23T01:00:00Z
CloudWatch Best Practices
- Monitor business-critical services first.
- Use metrics and logs together.
- Install CloudWatch Agent when OS-level metrics are required.
- Create actionable alarms.
- Avoid excessive alerting.
- Use dashboards for operational visibility.
- Monitor errors and latency, not only CPU.
- Define meaningful thresholds based on workload behavior.
- Review alarms periodically.
- Set appropriate log retention periods.
- Protect monitoring permissions using least privilege.
- Test notification paths.
- Document what engineers should do when critical alarms fire.
Example Production Alerting Strategy
                    Production
                        |
          +-------------+-------------+
          |             |             |
         EC2           RDS           ALB
          |             |             |
          +-------------+-------------+
                        |
                   CloudWatch
                        |
       +----------------+----------------+
       |                |                |
     Metrics           Logs           Errors
       |                |                |
       +----------------+----------------+
                        |
                    Alarms
                        |
                        v
                       SNS
                        |
               +--------+--------+
               |                 |
           On-Call Team     Automation
This architecture separates data collection, detection and response. That makes the monitoring system easier to maintain and troubleshoot.
Final Thoughts
Amazon CloudWatch is much more than a CPU monitoring dashboard. It can provide a central monitoring layer for AWS infrastructure, applications and operational events.
A practical monitoring strategy combines metrics, logs, dashboards, alarms and notifications. Infrastructure metrics help detect resource problems, while application logs and service-specific metrics help engineers understand what is happening.
Start with the services that matter most to your application, create a small number of actionable alarms, and gradually expand monitoring as your environment grows.
The objective is not to collect every possible metric. The objective is to detect important problems early, provide enough information to investigate them and make sure the right people or systems can respond.